The NetPhantom Advanced Diagnostics enables remote management connections to the Java Virtual Machine running the NetPhantom Server using the Java Management framework.
In order to remotely connect a monitoring software such as jConsole (included in the Java Development Kit) or the VisualVM tool, the Java Management framework must be enabled and allow the tool to connect to the Java VM. This connection is established with two sockets (technically: one for JMX and one for RMI). The NetPhantom Server Administration program is enhanced with the capability to start and stop the Java Management framework with these two ports, and further to tunnel these ports securely to the remote machine running the NetPhantom Client.
The tools jConsole or VisualVM can then be started and connect to the NetPhantom Server Java VM through these tunnels from the Client to the Server.
To start the management service and the tunnels, select the menu item Server - Advanced diagnostics in the Server Administration program.
Enter the JMX port and RMI port, in our case 8889 and 8890 respectively, and press Start service. Once the management service is started, the socket tunnels on these ports from the Client to the Server can be started using Open tunnels.
The tunnels use the same communication link as the NetPhantom Client, thus also its protocol security (SSL and/or 32-bit encryption).
The tunnel remains open as long as the Advances diagnostics dialog box is displayed and the NetPhantom
Client is running. The Java management service(s) remains running until the Server is stopped, restarted or
upgraded.
Using VisualVM
The tool VisualVM is installed with the Java Development Kit and it can be used by:
- Application Developers to monitor, profile, take thread dumps, browse heap dumps,
- System Administrators to monitor and control Java applications across the entire network,
- Java Application Users to create bug reports containing all the necessary information.
Connecting VisualVM to the NetPhantom Server from another machine requires you to:
- Start NetPhantom Client with Server Administration, select menu item Server - Advanced diagnostics.
- Configure a service with e.g. JMX port 8889 and RMI port 8890, press Start service and Open tunnels.
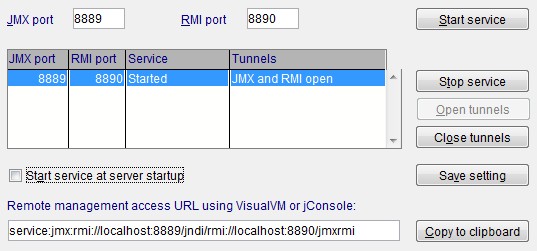
- Press the button Copy to clipboard to copy the URL of the Java management service (e.g.
service:jmx:rmi://localhost:8889/jndi/rmi://localhost:8890/jmxrmi).
- Launch VisualVM. Press the Launch VisualVM button. If the button is disabled, NetPhantom has not found the
JDK or the VisualVM application. Then launch it manually by starting the jvisualvm.exe program in the bin
directory in the Java JDK directory.

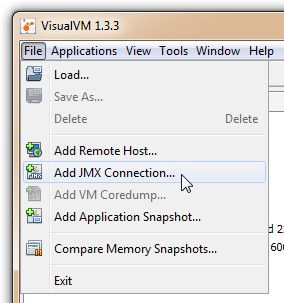
- Select menu item File - Add JMX Connection.
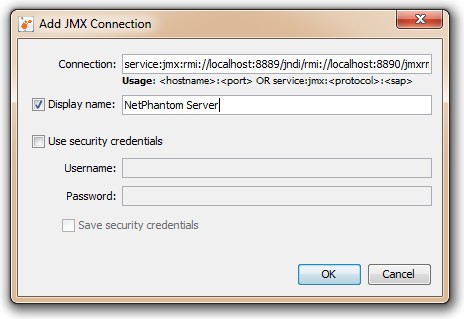
- Press Ctrl+V to paste the URL into the Connection entry field, check Display name and enter
NetPhantom Server. Then press OK.
- In the main window of VisualVM, double-click NetPhantom Server.
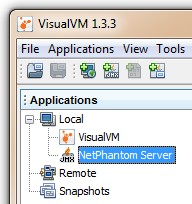
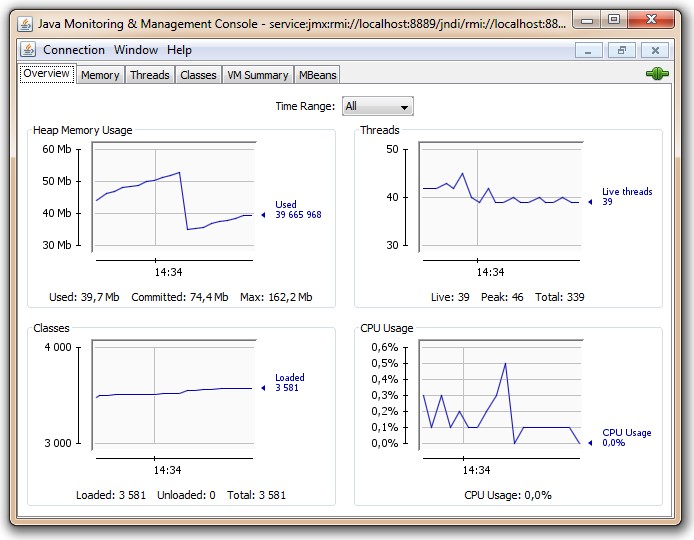
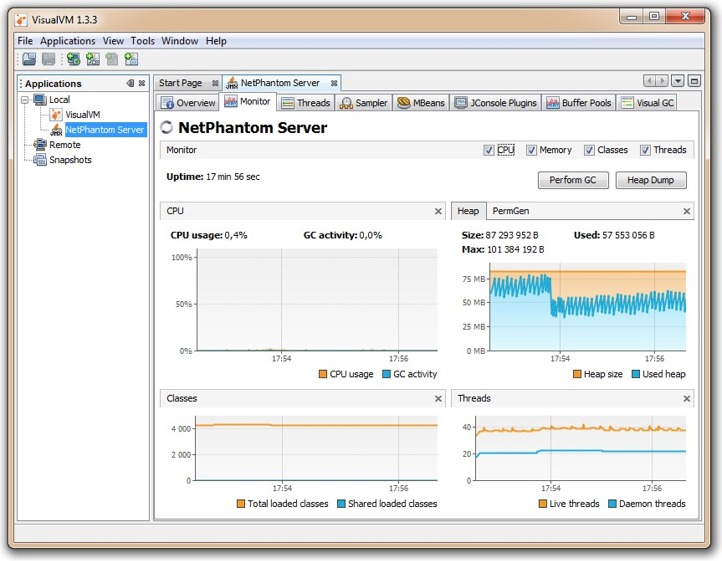
The main area in VisualVM will then show you, depending on the plug-ins installed, the window below.
Using jConsole
With the NetPhantom Server Administration program, perform the following steps when using a remote connection to the NetPhantom Server:
- Select menu item Server - Advanced diagnostics.
- Configure a service with e.g. JMX port 8889 and RMI port 8890, press Start service and Open tunnels.
- Press Launch jConsole and the Server Administration program will launch jConsole with the appropriate service connection.
If the push button to launch jConsole is not enabled, NetPhantom has not found the JDK or the jConsole application.
In this case, press the button Copy to clipboard to copy the URL of the Java management service (e.g. service:jmx:rmi://localhost:8889/jndi/rmi://localhost:8890/jmxrmi).
Then launch jConsole manually by starting the jconsole.exe program in the bin directory in the Java JDK directory.
The connection dialog box is displayed:
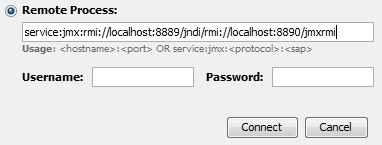
Press Ctrl+V to paste the URL into the Remote process entry field, leave Username and Password empty and press Connect.
Once jConsole is connected, the following window is displayed: